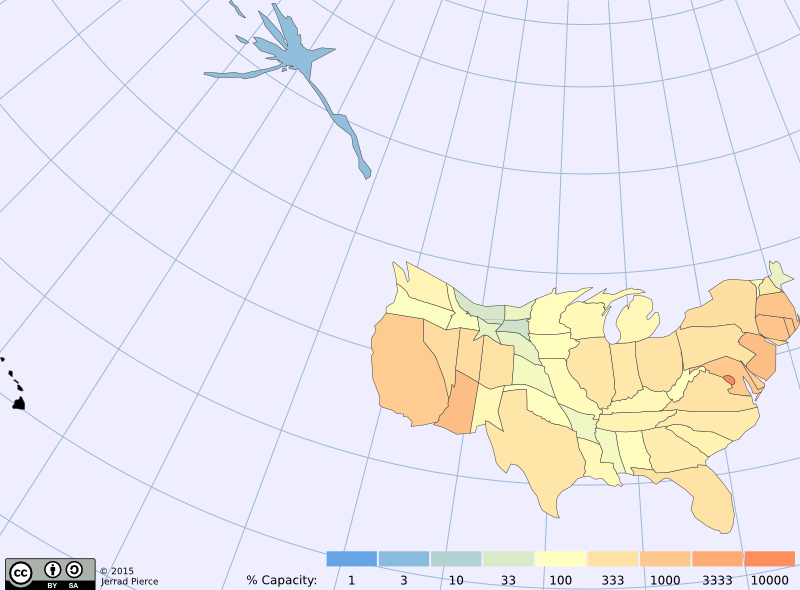
The map below displays the American impact on the environment through consumption of natural resources as measured by the ecological footprint for each state. States are scaled to represent their total consumption of resources, which is dependent upon both population and average use patterns. States are colored on a logarithm scale to represent how much of the state's native resource production this consumption appropriates. Redder states consume more than they produce, whereas bluer states are living within their means; hover over a region for exact figures. As a whole, the United States consumed 1.8× the natural resources available within its borders in 2010.
You may use or adapt the map above under the Creative Commons license specified without fee or permission—although I would appreciate being notified—or contact me for other licensing terms. All other works are the property of their respective creators.
Adapted by Jerrad Pierce from cartogram.js (d3.js, TopoJSON) example by Shawn Allen, with: d3-legend, FileSaver.js and Blob.js. Using Natural Earth state boundaries, colorbrewer styles, and data from the "State of the States: A New Perspective on the Wealth of Our Nation" report by Global Footprint Network and Earth Economics